3QFY2019 Result Update | Pharmaceutical
February 8, 2019
Aurobindo Pharma
BUY
CMP
`761
Performance Highlights
Target Price
`890
Y/E march (` cr)
3QFY19 2QFY19
% chg (QoQ) 3QFY18
% chg (yoy)
Net sales
5,175
4,667
10.9
4,269
21.2
Investment Period
12 months
Other income
161
111
45.2
100
60.4
Sector
Pharmaceutical
Operating profit
992
875
13.3
958
3.5
Market Cap (` cr)
45,715
Interest
48
35
34.8
19
152.9
Net debt (` cr)
3,277
Adj. Net profit
732
632
15.7
595
23.0
Beta
1.0
Source: Company, Angel Research
52 Week High / Low
830/527
Avg. Daily Volume
180,352
Face Value (`)
1
For 3QFY2019, Aurobindo Pharma (APL), the company posted sales of `5,175cr
BSE Sensex
35,457
v/s. `4,269cr in 3QFY2018, a yoy growth of 21.2%. On the operating front, the
Nifty
10,682
Reuters Code
ARBN.BO
EBITDA margin came in at 19.2% v/s. 22.5% in 3QFY2018. YoY decline is on the
Bloomberg Code
ARBP@IN
back of sales of certain high margin products in 3QFY18. Sequentially EBDITA
margins expanded by ~40bp. Consequently, the Adj. PAT came in at `732cr v/s.
Shareholding Pattern (%)
`595cr in 3QFY2018, a yoy growth of 23.0%. We recommend our buy rating on
Promoters
51.9
the stock.
MF / Banks / Indian Fls
17.7
FII / NRIs / OCBs
20.6
EBDITA Margins expands QoQ: On sales front, the company posted sales of
Indian Public / Others
9.8
5,175cr v/s. `4,269cr in 3QFY2018, a yoy growth of 21.2%. The formulation sales
(`4,348cr) posted a yoy growth of 21.8%, while API (`922cr) posted a yoy growth
Abs. (%)
3m 1yr
3yr
of 20.8%. Europe & ROW (`1,633cr) posted a yoy growth of 14.9%, while
Sensex
4.4
7.2
50.5
Aurobindo
(2.6)
23.4
1.9
company’s key market USA (`2,434cr) posted a growth of 27.4% yoy. On the
operating front, the EBITDA margin came in at 19.2% v/s. 22.5% in 3QFY2018. YoY
decline is on the back of sales of certain high margin products in 3QFY18.
Sequentially EBDITA margins expanded by ~40bp. Consequently, the Adj. PAT
came in at `732cr v/s. `595cr in 3QFY2018, a yoy growth of 23.0%.
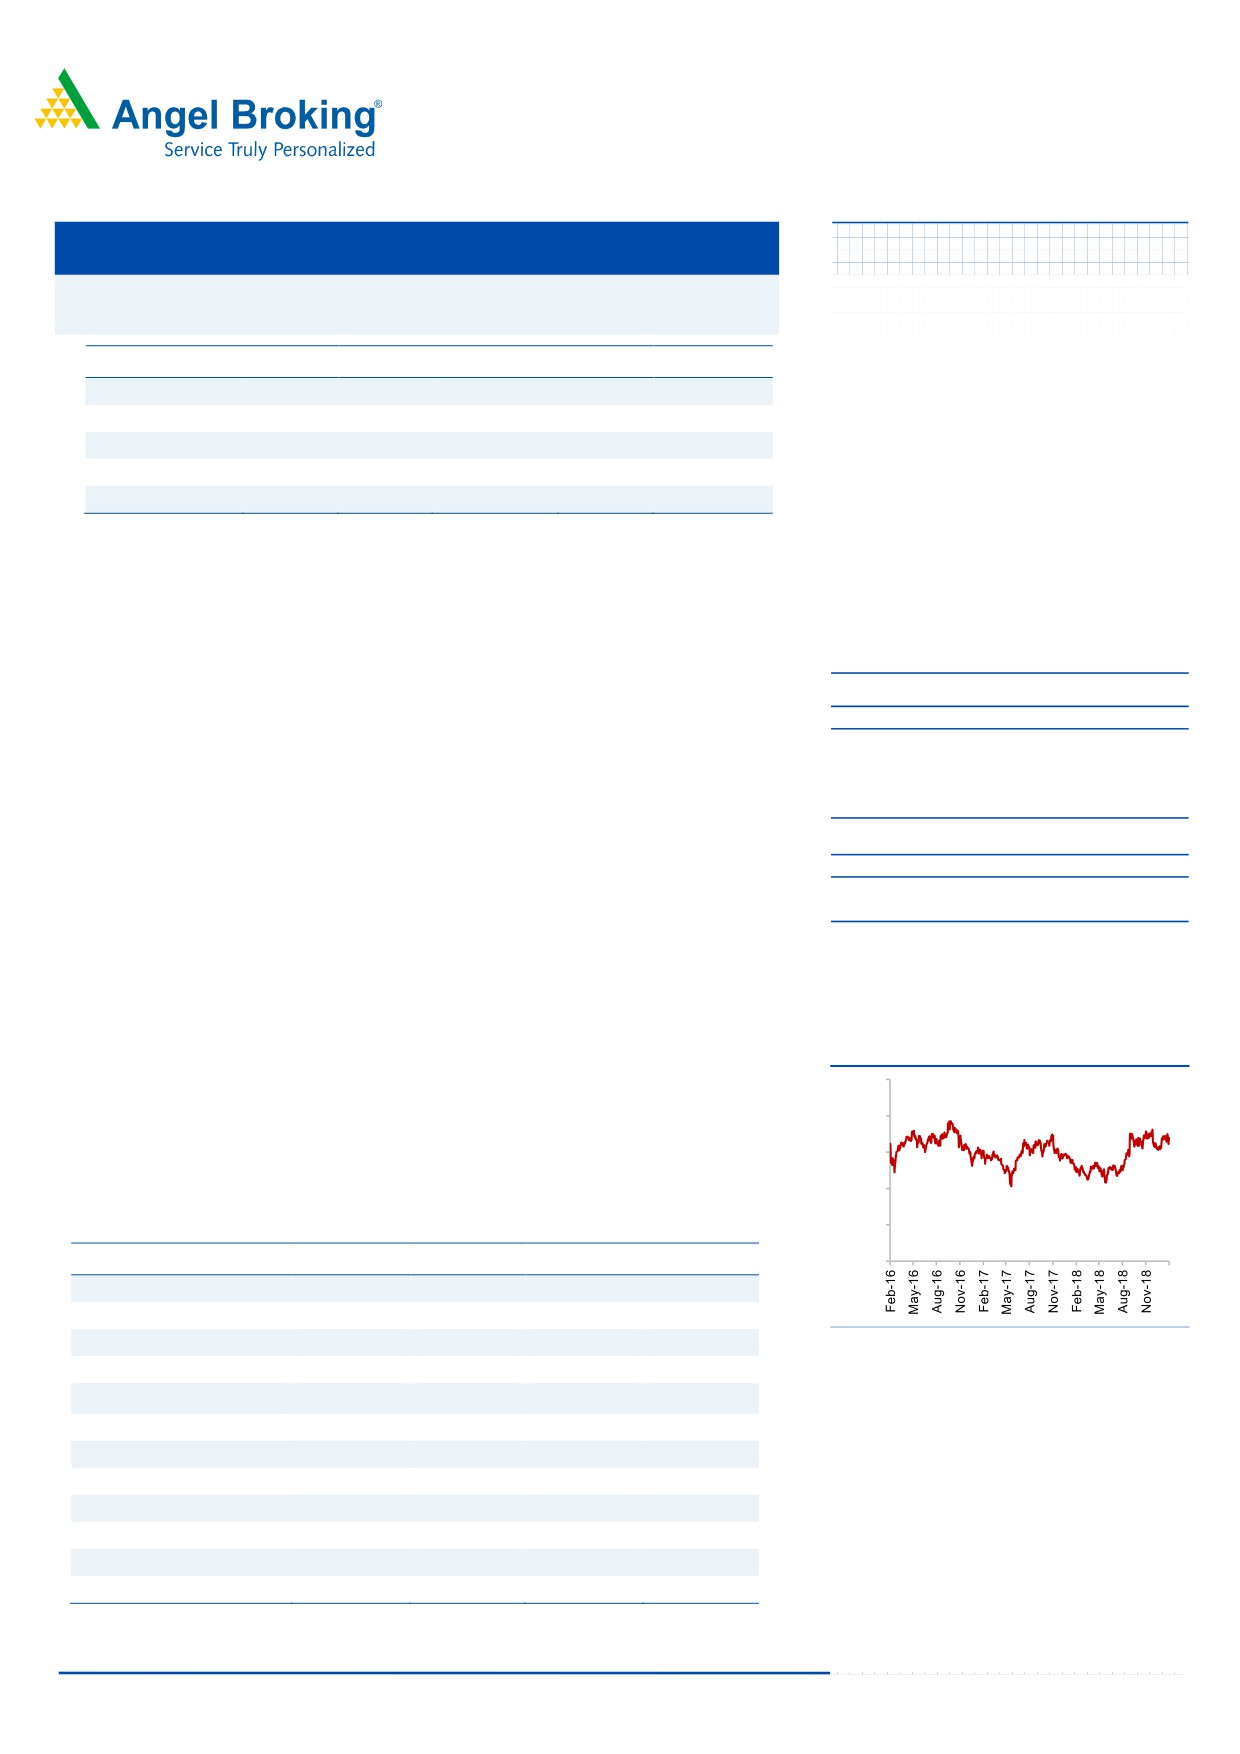
3-year daily price chart
1,100
Outlook and valuation: We expect Aurobindo to report net revenue CAGR of
~22% & net profit to grow at ~19% CAGR during FY2018-21E, due to inorganic
900
growth. Valuations of the company at 12.9xFY2020E are cheap V/s its peers and
700
own fair multiples of 17-18x.We recommend a Buy rating on the stock.
500
300
Key financials (Consolidated)
Y/E March (` cr)
FY2018
FY2019E
FY2020E
FY2021E
100
Net sales
16,233
18,799
24,234
27,188
% chg
9.4
15.8
28.9
12.2
Adj. Net profit
2,423
2,575
3,438
3,856
Source: Company, Angel Research
% chg
5.3
6.3
33.5
12.2
EPS (`)
41.5
44.1
58.9
66.0
EBITDA margin (%)
21.6
19.6
21.9
21.8
P/E (x)
18.3
17.3
12.9
11.5
RoE (%)
23.0
20.1
22.2
20.6
RoCE (%)
20.6
17.0
22.1
22.3
P/BV (x)
3.8
3.2
2.6
2.2
EV/Sales (x)
2.9
2.5
1.9
1.7
Sarabjit Kour Nangra
EV/EBITDA (x)
13.6
12.9
8.8
7.6
+91 22 3935 7800 Ext: 6806
Source: Company, Angel Research; Note: CMP as of February 8, 2019
Please refer to important disclosures at the end of this report
1
Aurobindo Pharma | 3QFY2019 Result Update
Exhibit 1: 3QFY2019 performance (Consolidated)
% chg
% chg
% chg
Y/E March (` cr)
3QFY2019 2QFY2019
3QFY2018
9MFY2019 9MFY2018
(QoQ)
(yoy)
(yoy)
Net sales
5,175
4,667
10.9
4,269
21.2
14,024
12,244
14.5
Other income
161
111
45.2
100
60.4
273
267
2.3
Total income
5,336
4,778
11.7
4,369
22.1
14,297
12,511
14.3
Gross profit
2,785
2,624
6.1
2,451
13.6
7,684
7,161
7.3
Gross margins
53.8
56.2
57.4
54.8
58.5
Operating profit
992
875
13.3
958
3.5
2,644
2,778
(4.8)
OPM (%)
19.2
18.8
2.2
22.5
18.9
22.7
Interest
48
35
34.8
19
152.9
113
53
112.5
Dep & amortisation
163
164
(0.4)
138
18.1
481
401
19.9
PBT
942
787
19.7
902
4.5
2,324
2,591
(10.3)
Provision for taxation
205
175
16.7
307
(33.3)
496
696
(28.8)
Net profit
737
611
20.6
595
23.9
1,828
1,895
(3.5)
Less : Exceptional items (gains)/loss
25
-
-
52
-
-
MI & share in associates
(0)
0
(0)
3
(1)
-
PAT after Exceptional items
712
611
16.5
595
19.7
1,779
1,894
(6.1)
Adjusted PAT
732
632
15.7
595
23.0
1,820
1,894
(3.9)
EPS (`)
12.5
10.8
10.2
31.1
32.3
Source: Company, Angel Research
Revenue up 21.2% yoy; driven by both API & Formulations: On sales front,
the company posted sales of 5,175cr v/s. `4,269cr in 3QFY2018, a yoy growth of
21.2%. The formulation sales (`4,348cr) posted a yoy growth of 21.8%, while API
(`922cr) posted a yoy growth of 20.8%. Europe & ROW (`1,633cr) posted a yoy
growth of 14.9%, while company’s key market USA (`2,434cr) posted a growth of
27.4% yoy. Overall, formulations now contribute around 82.5% of sales, while the
balance is accounted by APIs.
The formulation sales (`4,348cr) posted a yoy growth of 21.8%. Within which US
business contributed 46.2% to the gross sales. On a constant currency basis, sales
grew by 14.7% YoY. The company filed 10 ANDAs with USFDA including 4 ANDAs
for injectable products.Received final approval for 14 ANDAs and tentative approval
for 1 ANDAs. The company has 519 approved ANDAs including 28 tentative
approvals. EU sales, inched up by 10.3% YoY. The business accounted for 24.5% of
revenues. In Euro terms, sales increased by 2.5% yoy.
ARV business sales increased by 17.8% YoY to `281cr compared to `239cr in 3QFY18
and accounted for 5.3% of revenues. Sales from growth markets formulations
posted a strong growth of 36.1% yoy to `341cr in 3QFY2019 and accounted for
~6.5% of revenues.
API business posted a growth of 20.4% to `922cr & contributed 17.5% of the total
revenue during the quarter. The growth was on the back of increase in Non-
Betalactum segment. The company filed 1 DMFs with USFDA during the quarter
taking total DMFs filing to 236 as on 31st Dec 2018.
February 8, 2019
2
Aurobindo Pharma | 3QFY2019 Result Update
Exhibit 2: Sales break-up (Consolidated)
(` cr)
3QFY2019
2QFY2019
% chg (qoq)
3QFY2018
% chg (yoy)
9MFY2019
9MFY2018
% chg
Formulations
4348
3935
10.5
3570
21.8
11784
10284.3
14.6
US
2434
2227
9.3
1910
27.4
6550
5704
14.8
Europe & ROW
1633
1464
11.6
1422
14.9
4553
3890
17.1
ARV
281
244
15.3
239
17.7
681
691
(1.4)
API
922
817
12.9
766
20.4
2486
2163
14.9
SSP
558
513
8.6
537
3.9
1563
1460
7.1
Cephs
364
303
20.1
229
58.9
923
703
31.3
Total Sales
5270
4751
10.9
4336
21.5
14270
12447
14.6
Source: Company, Angel Research
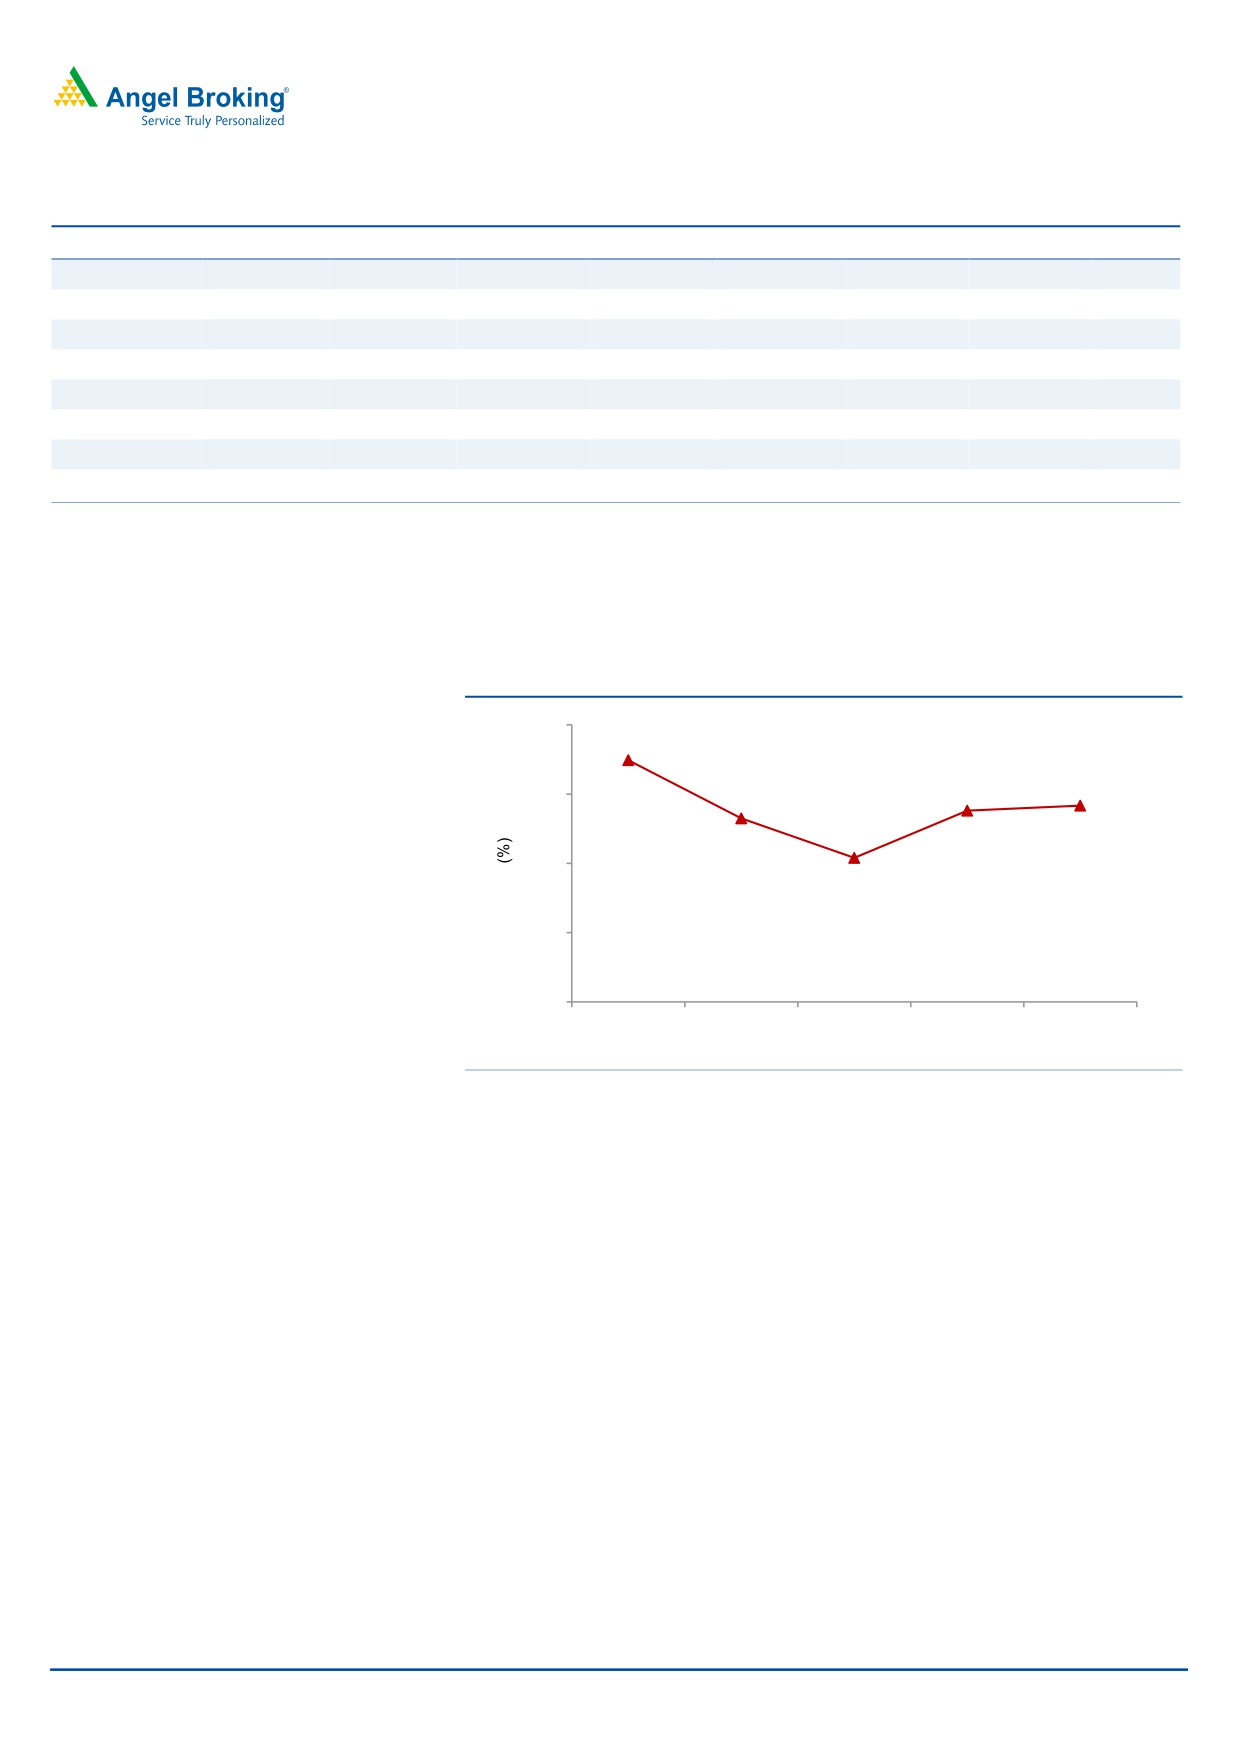
OPM comes in at 19.2%; QoQ expansion: on the operating front, the EBITDA
margin came in at 19.2% v/s. 22.5% in 3QFY2018. YoY decline is on the back of sales
of certain high margin products in 3QFY18.Sequentially EBDITA margins expanded
by ~40bp. Research & Development (R&D) spend at `255cr, 4.8% of sales.
Exhibit 3: OPM Trend
25.0
22.5
18.8
19.2
20.0
18.2
15.0
15.4
10.0
5.0
3QFY2018
4QFY2018
1QFY2019
2QFY2019
3QFY2019
Source: Company, Angel Research
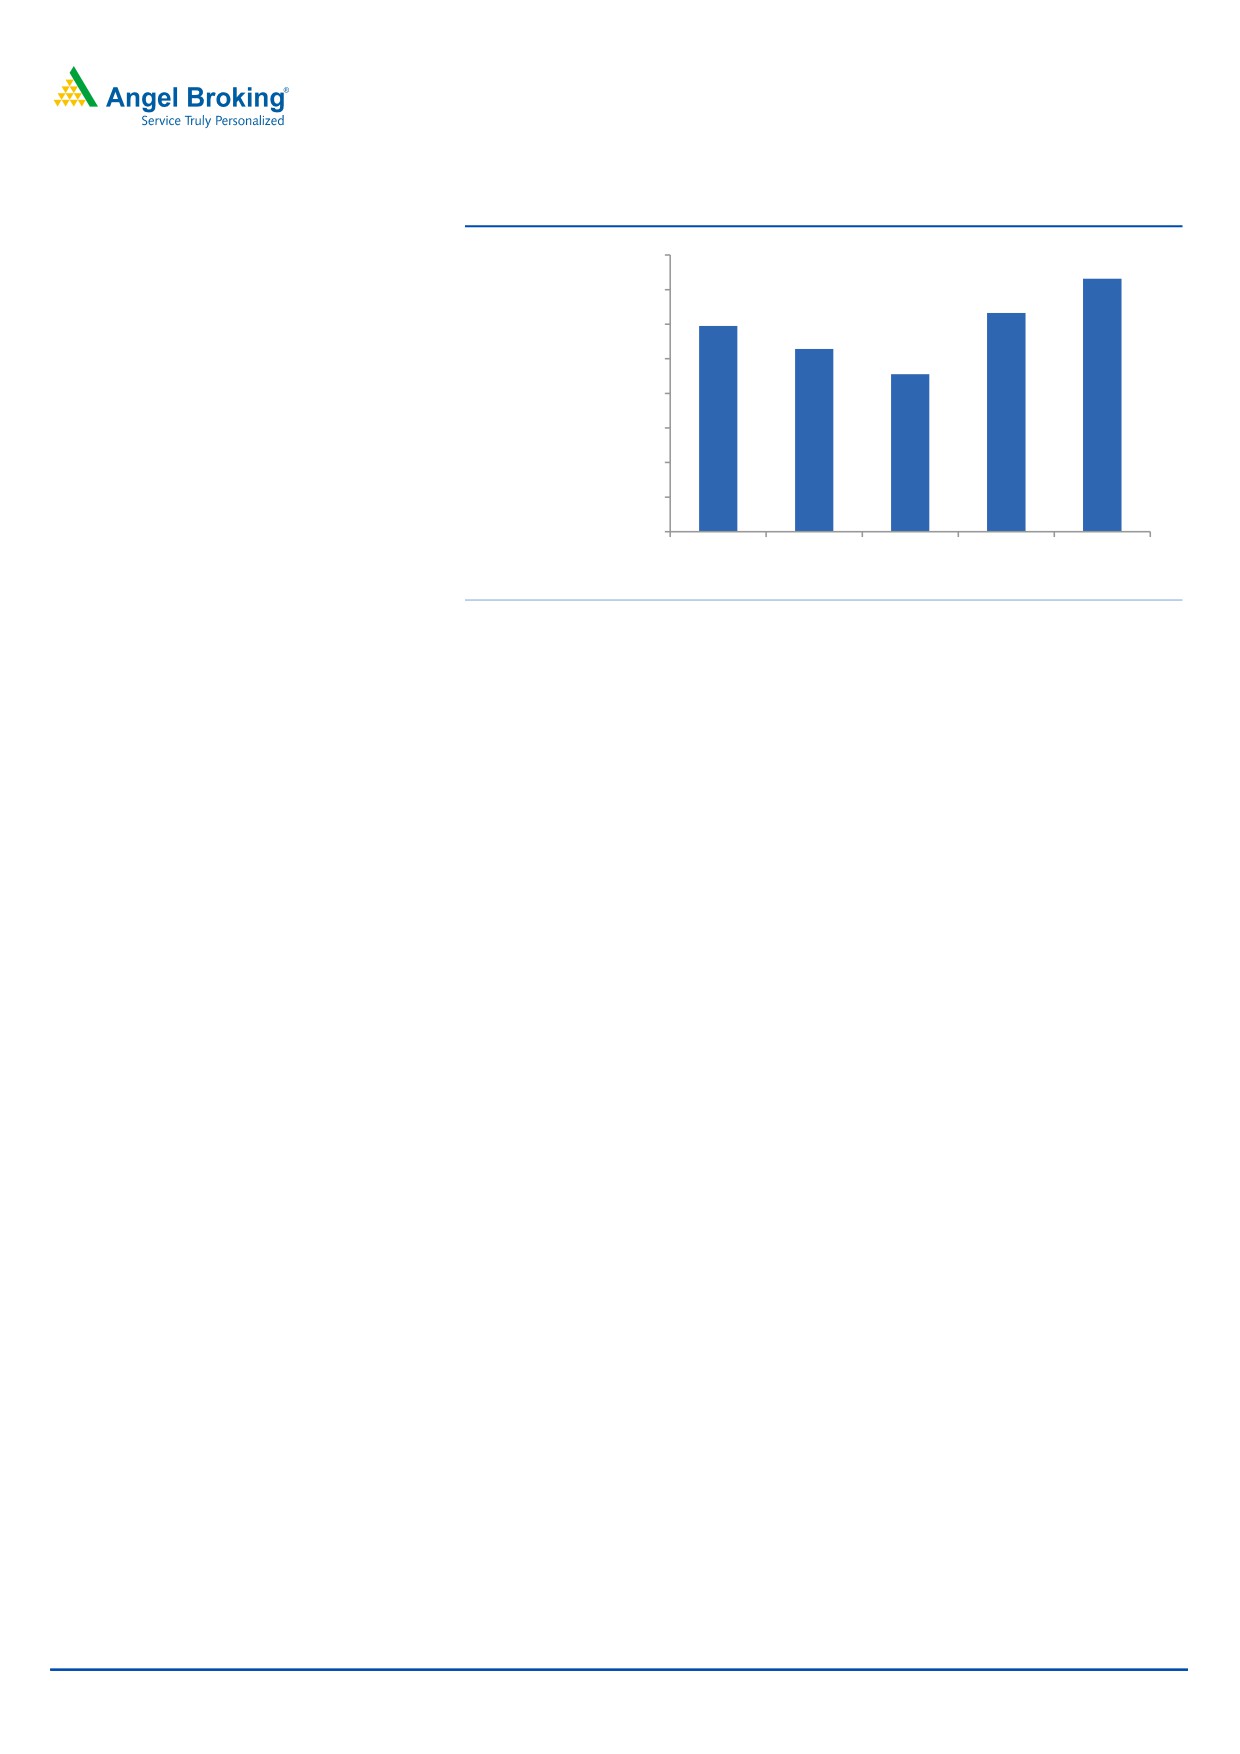
Net profit inches up: Insipte of moderate rise in operating profit, Adj. PAT came
in at `732cr v/s. `595cr in 3QFY2018, a yoy growth of 23.0%; mainly aided by growth
of other income. Other income rose by 60.4% yoy. In addition, there was a 33.3%
yoy dip in the tax expenses of the company.
February 8, 2019
3
Aurobindo Pharma | 3QFY2019 Result Update
Exhibit 4: Adj. net profit
800
732
700
632
595
600
529
500
456
400
(`cr)
300
200
100
0
3QFY2018 4QFY2018 1QFY2019 2QFY2019 3QFY2019
Source: Company, Angel Research
Recommendation rationale
Well placed for challenging times in USA: Aurobindo has a robust pipeline
(has filed 519 ANDA’s; second highest amongst Indian companies) & is
investing to enhance its foray into complex generic (mainly injectables,
ophthalmic etc.) & biosimilar, which will drive its next leg of growth. In the
current price competitive market, company is well placed; given it is vertically
integrated with 70% of raw material requirements being meet through
internally. In addition, almost no single product of the company contributes
than 3% of sales; unlike others peers, who have high product concentration.
This is also evident from the performance of the company in USA in FY2018.
Company expects pricing pressure to stabilize at +/- 5% yoy over the
medium term. The company expects to launch ~30-40 products in the US,
which will aid growth in the US business.
During 2QFY2019, Aurobindo Pharmaceuticals (APL) has acquired
dermatology and oral solids businesses from Sandoz Inc., USA for an upfront
purchase price of US$0.9bn in cash. With this acquisition, Aurobindo adds
sales of US$0.9bn and would become the 2nd largest generic player in the US
by number of prescriptions. Acquisition is funded by debt and values the
acquired company at 1.0xEV/sales, which we believe given the size and scope
of the business acquired is very attractive. The transaction will lead to net
debt to Equity reaching almost 0.6xFY2020E numbers and fully reflect in the
FY2021 financials. The acquired business, as guided by the Management has
EBDITA margins in line with APL (20-22%), making the deal attractive in terms
of payback also. Transaction is expected to be accretive to normalized EPS
from first full year of ownership.
In 3QFY2019, APL acquired portfolio of seven marketed oncology injectable
products from Spectrum Pharmaceuticals. Aurobindo Pharma Limited will be
acquiring the portfolio on a debt free and cash free basis. The acquisition will
help Aurobindo to enter the branded oncology market with a range of
products, which are well recognized by the oncology Industry. The portfolio
is expected to generate a revenue of around US$100mn for the first 12
months after completion of the transaction for Aurobindo. Acquisition will
February 8, 2019
4
Aurobindo Pharma | 3QFY2019 Result Update
be for an upfront purchase price of US$160mn in cash plus up to US$140mn
on achieving regulatory and sales-based milestones. Acquisition values the
acquired company at 1.6xMarketCap/sales (on upfront payment), which we
believe is attractive. The acquired business, as guided by the Management
has EBDITA margins better than APL (20-22%), making the deal attractive in
terms of payback also. Transaction is expected to be accretive to normalized
EPS from first full year of ownership and will augment the net profit growth
by 3% on a full year basis (as the acquired entity).
Overall, on back of these acquisitions, USA will grow at 21.4% CAGR over
FY2018-21E.
Europe to grow steady, while ARV could provide extra boost: Europe,
which is another key region for the company, is expected to post CAGR of
20.0% during FY2018-21E, while ROW is expected to post a CAGR of 18.0%
during same period. However, growth during the period would be more
predominate in the ARV segment, where company has confirmed tenders of
US$80-100mn to be executed over next two years.
Outlook and valuation
We expect Aurobindo to report net revenue CAGR of ~22% & net profit to grow at
~19% CAGR during FY2018-21E, due to acquisitions. Valuations of the company at
12.9xFY2020E are cheap V/s its peers and own fair multiples of 17-18x.We
recommend a buy rating on the stock.
Exhibit 5: Key assumptions
FY2020E
FY2021E
Sales Growth (%)
28.9
12.2
Operating Margins (%)
21.7
21.6
Capex (`cr)
1,200
1,200
Source: Company, Angel Research
Company background
Aurobindo Pharma manufactures generic pharmaceuticals and APIs. The
company’s manufacturing facilities are approved by several leading regulatory
agencies like the USFDA, UK MHRA, WHO, Health Canada, MCC South Africa and
ANVISA Brazil among others. The company’s robust product portfolio is spread
over six major therapeutic/product areas encompassing antibiotics,
antiretrovirals, CVS, CNS, gastroenterological, and anti-allergics. The company has
acquired the generic business of Actavis, which has made it a US$2bn company and
a leading company in Europe. With this acquisition, formulations now contribute
around 83% to the company’s sales (as in FY2018).
February 8, 2019
5
Aurobindo Pharma | 3QFY2019 Result Update
Company background
Aurobindo Pharma manufactures generic pharmaceuticals and APIs. The company’s
manufacturing facilities are approved by several leading regulatory agencies like the
USFDA, UK MHRA, WHO, Health Canada, MCC South Africa and ANVISA Brazil
among others. The company’s robust product portfolio is spread over six major
therapeutic/product
areas
encompassing
antibiotics,
antiretrovirals, CVS, CNS, gastroenterological, and anti-allergics. The company has
acquired the generic business of Actavis, which has made it a US$2bn company and
a leading company in Europe. With this acquisition, formulations now contribute
around 83% to the company’s sales (as in FY2018).
Profit & loss statement (Consolidated)
Y/E March (` cr)
FY2016
FY2017
FY2018
FY2019E FY2020E FY2021E
Gross sales
13,937
15,084
16,493
19,085
24,604
27,602
Less: Excise duty
227
239
260
286
369
414
Net Sales
13,710
14,845
16,233
18,799
24,234
27,188
Other operating income
245
245
267
267
267
267
Total operating income
13,955
15,090
16,500
19,066
24,501
27,455
% chg
15.1
8.1
9.3
15.6
28.5
12.1
Total Expenditure
10,931
11,656
12,728
15,119
18,934
21,257
Net Raw Materials
6,162
6,434
6,753
8,178
10,251
11,229
Other Mfg costs
1,371
1,484
1,623
1,880
2,423
2,719
Personnel
1,543
1,768
2,131
2,493
2,992
3,590
Other
1,386
1,426
1,555
1,710
1,881
2,069
EBITDA
2,486
2,779
3,189
3,505
3,901
4,890
(% of Net Sales)
20.3
21.5
21.6
19.6
21.9
21.8
Depreciation& Amort.
392
428
558
678
879
975
EBIT
2,386
2,762
2,947
3,002
4,422
4,956
(% of Net Sales)
17.4
18.6
18.2
16.0
18.2
18.2
Interest & other Charges
93
67
78
156
149
116
Other Income
205
121
105
105
105
105
Recurring PBT
2,744
3,061
3,241
3,217
4,646
5,213
Tax
720.7
759.6
818.3
643.5
1,207.9
1,355.4
(% of PBT)
26.3
24.8
25.2
20.0
26.0
26.0
PAT after MI (reported)
2,025
2,302
2,423
2,575
3,438
3,856
ADJ. PAT
2,025
2,302
2,423
2,575
3,438
3,856
% chg
25.1
13.7
5.3
6.3
33.5
12.2
Basic EPS (`)
34.6
39.3
41.4
44.0
58.7
65.9
% chg
25.1
13.7
5.3
6.3
33.5
12.2
February 8, 2019
6
Aurobindo Pharma | 3QFY2019 Result Update
Balance sheet (Consolidated)
Y/E March (` cr)
FY2016
FY2017
FY2018 FY2019E
FY2020E FY2021E
SOURCES OF FUNDS
Equity Share Capital
59
59
59
59
59
59
Share Application Money
-
-
-
-
-
-
Reserves & Surplus
7,229
9,313
11,622
13,895
16,931
20,336
Shareholders Funds
7,287
9,372
11,680
13,954
16,989
20,394
Minority Interest
3
2
2
1
1
2
Long-term provisions
23
22
56
56
56
56
Total Loans
4,415
3,084
4,483
5,000
4,000
3,000
Deferred Tax Liability
(182)
(118)
76
76
76
76
Total Liabilities
11,546
12,362
16,297
19,031
21,067
23,473
APPLICATION OF FUNDS
Gross Block
6,093
7,625
8,998
10,386
11,586
12,786
Less: Acc. Depreciation
2,186
2,614
3,172
3,850
4,729
5,704
Net Block
3,907
5,011
5,826
6,535
6,856
7,082
Capital Work-in-Progress
310
310
310
310
310
310
Goodwill
812
971
1,968
1,968
1,968
1,968
Investments
123
246
312
312
312
312
Long-term loans and adv.
269
338
343
343.32
397.59
512.55
Current Assets
10,294
9,206
12,188
14,948
18,165
21,077
Cash
834
513
1,262
2,296
1,858
2,783
Loans & Advances
831
409
10
10
10
11
Other
8,629
8,284
10,916
12,642
16,297
18,283
Current liabilities
4,168
3,720
4,649
5,384
6,941
7,786.93
Net Current Assets
6,127
5,487
7,539
9,563
11,224
13,290
Mis. Exp. not written off
-
-
-
-
-
-
Total Assets
11,546
12,362
16,297
19,031
21,067
23,473
February 8, 2019
7
Aurobindo Pharma | 3QFY2019 Result Update
Cash flow statement (Consolidated)
Y/E March (` cr)
FY2016
FY2017
FY2018 FY2019E FY2020E FY2021E
Profit before tax
2,744
3,061
3,241
3,217
4,646
5,213
Depreciation
392
428
558
678
879
975
(Inc)/Dec in Working Capital
(1,333)
388
(1,298)
(990)
(2,044)
(1,026)
Less: Other income
205
121
105
105
105
105
Direct taxes paid
(721)
(760)
(818)
(643)
(1,208)
(1,355)
Cash Flow from Operations
877
2,996
1,577
2,157
2,167
3,701
(Inc.)/Dec.in Fixed Assets
3
(1,532)
(1,374)
(1,388)
(1,200)
(1,200)
(Inc.)/Dec. in Investments
103
123
66
-
-
-
Other income
205
121
105
105
105
105
Cash Flow from Investing
311
(1,288)
(1,203)
(1,282)
(1,095)
(1,095)
Issue of Equity
-
-
-
-
-
-
Inc./(Dec.) in loans
552
(1,331)
1,398
517
(1,000)
(1,000)
Dividend Paid (Incl. Tax)
(171)
(171)
(171)
(301)
(402)
(451)
Others
(1,204)
(527)
(854)
(56)
(109)
(230)
Cash Flow from Financing
(823)
(2,030)
373
160
(1,511)
(1,681)
Inc./(Dec.) in Cash
365
(321)
748
1,035
(439)
925
Opening Cash balances
469
834
513
1,262
2,296
1,858
Closing Cash balances
834
513
1,262
2,296
1,858
2,783
February 8, 2019
8
Aurobindo Pharma | 3QFY2019 Result Update
Key ratios
Y/E March
FY2016
FY2017
FY2018 FY2019E
FY2020E
FY2021E
Valuation Ratio (x)
P/E (on FDEPS)
22.0
19.3
18.4
17.3
13.0
11.5
P/CEPS
18.4
16.3
14.9
13.7
10.3
9.2
P/BV
6.1
4.8
3.8
3.2
2.6
2.2
Dividend yield (%)
0.3
0.3
0.3
0.6
0.8
0.9
EV/Sales
3.5
3.2
2.9
2.5
1.9
1.6
EV/EBITDA
17.3
14.8
13.6
12.9
8.8
7.6
EV / Total Assets
4.2
3.8
2.9
2.5
2.2
1.9
Per Share Data (`)
EPS (Basic)
34.6
39.3
41.4
44.0
58.7
65.9
EPS (fully diluted)
34.6
39.3
41.4
44.0
58.7
65.9
Cash EPS
41.3
46.6
50.9
55.6
73.8
82.6
DPS
2.5
2.5
2.5
4.4
5.9
6.6
Book Value
124.5
160.1
199.6
238.4
290.3
348.5
Dupont Analysis
EBIT margin
17.4
18.6
18.2
16.0
18.2
18.2
Tax retention ratio
73.7
75.2
74.8
80.0
74.0
74.0
Asset turnover (x)
1.4
1.3
1.2
1.2
1.4
1.4
ROIC (Post-tax)
18.3
18.7
16.7
15.3
18.4
18.6
Cost of Debt (Post Tax)
1.7
1.3
1.5
2.6
2.4
2.4
Leverage (x)
0.6
0.4
0.3
0.2
0.2
0.1
Operating ROE
27.9
25.4
20.8
18.3
21.0
19.7
Returns (%)
ROCE (Pre-tax)
22.9
23.1
20.6
17.0
22.1
22.3
Angel ROIC (Pre-tax)
26.5
27.4
25.3
22.1
28.2
28.0
ROE
32.5
27.6
23.0
20.1
22.2
20.6
Turnover ratios (x)
Asset Turnover (Gross Block)
2.3
2.2
2.0
2.0
2.2
2.3
Inventory / Sales (days)
100
101
113
120
113
117
Receivables (days)
107
89
65
65
65
65
Payables (days)
126
119
114
111
114
114
WC cycle (ex-cash) (days)
124
124
124
130
124
132
Solvency ratios (x)
Net debt to equity
0.5
0.3
0.3
0.2
0.1
0.0
Net debt to EBITDA
1.3
0.8
0.9
0.7
0.4
0.0
Interest Coverage (EBIT / Int.)
25.8
41.4
37.9
19.2
29.8
42.9
February 8, 2019
9
Aurobindo Pharma | 3QFY2019 Result Update
Research Team Tel: 022 - 39357800
DISCLAIMER
Angel Broking Limited (hereinafter referred to as “Angel”) is a registered Member of National Stock Exchange of India Limited, Bombay
Stock Exchange Limited, Metropolitan Stock Exchange Limited, Multi Commodity Exchange of India Ltd and National Commodity &
Derivatives Exchange Ltd It is also registered as a Depository Participant with CDSL and Portfolio Manager and Investment Adviser with
SEBI. It also has registration with AMFI as a Mutual Fund Distributor. Angel Broking Limited is a registered entity with SEBI for Research
Analyst in terms of SEBI (Research Analyst) Regulations, 2014 vide registration number INH000000164. Angel or its associates has not
been debarred/ suspended by SEBI or any other regulatory authority for accessing /dealing in securities Market. Angel or its
associates/analyst has not received any compensation / managed or co-managed public offering of securities of the company covered
by Analyst during the past twelve months.
This document is solely for the personal information of the recipient, and must not be singularly used as the basis of any investment
decision. Nothing in this document should be construed as investment or financial advice. Each recipient of this document should make
such investigations as they deem necessary to arrive at an independent evaluation of an investment in the securities of the companies
referred to in this document (including the merits and risks involved), and should consult their own advisors to determine the merits
and risks of such an investment.
Reports based on technical and derivative analysis center on studying charts of a stock's price movement, outstanding positions and
trading volume, as opposed to focusing on a company's fundamentals and, as such, may not match with a report on a company's
fundamentals. Investors are advised to refer the Fundamental and Technical Research Reports available on our website to evaluate the
contrary view, if any
The information in this document has been printed on the basis of publicly available information, internal data and other reliable
sources believed to be true, but we do not represent that it is accurate or complete and it should not be relied on as such, as this
document is for general guidance only. Angel Broking Limited or any of its affiliates/ group companies shall not be in any way
responsible for any loss or damage that may arise to any person from any inadvertent error in the information contained in this report.
Angel Broking Limited has not independently verified all the information contained within this document. Accordingly, we cannot
testify, nor make any representation or warranty, express or implied, to the accuracy, contents or data contained within this document.
While Angel Broking Limited endeavors to update on a reasonable basis the information discussed in this material, there may be
regulatory, compliance, or other reasons that prevent us from doing so.
This document is being supplied to you solely for your information, and its contents, information or data may not be reproduced,
redistributed or passed on, directly or indirectly.
Neither Angel Broking Limited, nor its directors, employees or affiliates shall be liable for any loss or damage that may arise from or in
connection with the use of this information.
Disclosure of Interest Statement
Aurobindo Pharma
1. Financial interest of research analyst or Angel or his Associate or his relative
No
2. Ownership of 1% or more of the stock by research analyst or Angel or associates or
No
relatives
3. Served as an officer, director or employee of the company covered under Research
No
4. Broking relationship with company covered under Research
No
Ratings (Based on expected returns
Buy (> 15%)
Accumulate (5% to 15%)
Neutral (-5 to 5%)
over 12 months investment period):
Reduce (-5% to -15%)
Sell (< -15)
February 8, 2019
10